As an indie software developer, I frequently have to deploy monitoring solutions for software I develop or support. I recently had the pleasure of exploring the evolution of Grafana from a visualization tool to a comprehensive monitoring suite with various modules. In this article, we'll dive into its collector and explore the journey of migrating to the new Alloy agent.
Introducing Alloy Collector
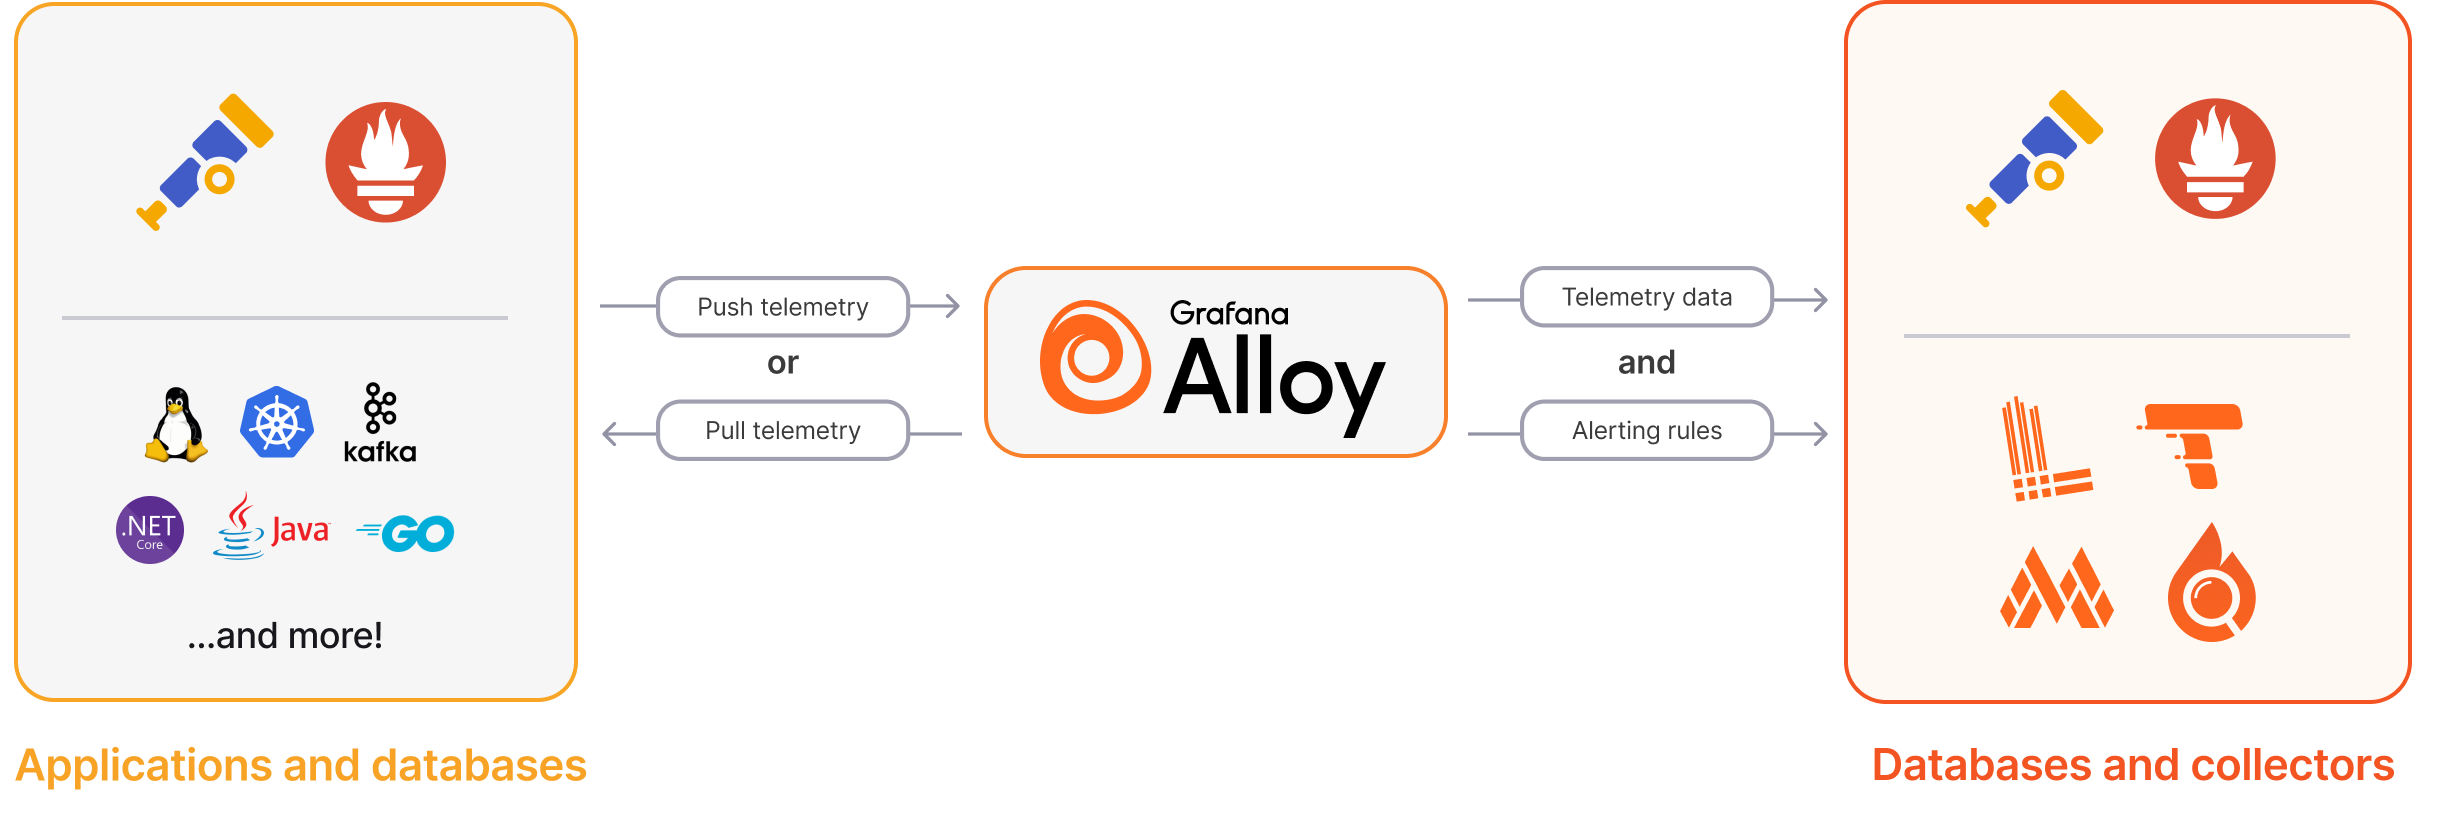
Alloy is the latest addition to the Grafana ecosystem, offering enhanced performance and scalability for data collection. Unlike its predecessor Flow Agent, Alloy introduces a more efficient and robust data ingestion mechanism. It's an open source distribution of the OpenTelemetry Collector that's 100% OTLP compatible.
Grafana Agent proved to be flexible, performant, and compatible with multiple ecosystems. Then they launched Promtail for Loki logs and the Grafana Agent Operator for Kubernetes-specific cases. It worked but the many options made it harder to determine which agents to use.
Grafana Agent and Grafana Agent Operator are deprecated and will enter into Long-Term Support beginning today (April 9, 2024). This means both projects will no longer receive new feature updates, as all future innovation will be focused on Alloy. Grafana Labs recommends to begin planning a transition towards the new Grafana Alloy collector.
Show me the code: deploy Alloy Collector
Using Alloy requires a minimal setup:
- grab your distribution package or binary
- create a service to auto start or use the distribution's provided one
- create a configuration file to manage some log/metrics ingestion and forward it to your Grafana instance of choice.
Given you installed the, let's say, Debian package you'll go ahead and create a configuration file in /etc/alloy/config.alloy:
prometheus.exporter.self "integrations_alloy" { }

discovery.relabel "integrations_alloy" {
  targets = prometheus.exporter.self.integrations_alloy.targets

  rule {
    target_label = "instance"
    replacement  = constants.hostname
  }

  rule {
    target_label = "alloy_hostname"
    replacement  = constants.hostname
  }

  rule {
    target_label = "job"
    replacement  = "integrations/alloy-check"
  }
}

prometheus.scrape "integrations_alloy" {
  targets    = discovery.relabel.integrations_alloy.output
  forward_to = [prometheus.relabel.integrations_alloy.receiver]

  scrape_interval = "60s"
}

prometheus.relabel "integrations_alloy" {
  forward_to = [prometheus.remote_write.metrics_service.receiver]

  rule {
    source_labels = ["__name__"]
    regex         = "(prometheus_target_sync_length_seconds_sum|prometheus_target_scrapes_.*|prometheus_target_interval.*|prometheus_sd_discovered_targets|alloy_build.*|prometheus_remote_write_wal_samples_appended_total|process_start_time_seconds)"
    action        = "keep"
  }
}

prometheus.remote_write "metrics_service" {
  endpoint {
    url = "{{ grafana_metrics_url }}"

    basic_auth {
      username = "{{ grafana_metrics_id }}"
      password = "{{ grafana_cloud_token }}"
    }
  }
}

loki.write "grafana_cloud_loki" {
  endpoint {
    url = "{{ grafana_logs_url }}"

    basic_auth {
      username = "{{ grafana_logs_id }}"
      password = "{{ grafana_cloud_token }}"
    }
  }
}

loki.relabel "journal" {
  forward_to = []

  rule {
    source_labels = ["__journal__systemd_unit"]
    target_label  = "unit"
  }
  rule {
    source_labels = ["__journal__boot_id"]
    target_label  = "boot_id"
  }
  rule {
    source_labels = ["__journal__transport"]
    target_label  = "transport"
  }
  rule {
    source_labels = ["__journal_priority_keyword"]
    target_label  = "level"
  }
  rule {
    source_labels = ["__journal__hostname"]
    target_label  = "instance"
  }
}

loki.source.journal "read" {
  forward_to = [
    loki.write.grafana_cloud_loki.receiver,
  ]
  relabel_rules = loki.relabel.journal.rules
  labels = {
    "job" = "integrations/node_exporter",
  }
}
This can be a nice starting point, it will:
- get metrics from the instance and tag/label them;
- grab the journal logs and tag/label them;
- push everything to Grafana Cloud (as long as you replace placeholders with real credentials).
Migrate to Alloy
If you are currently using Grafana tools, such as Grafana Agent or Grafana Agent Operator, Grafana Labs has converters and tools for moving to Grafana Alloy:
- Migrate from Operator
- Migrate from Prometheus
- Migrate from Promtail
- Migrate from Grafana Agent Static
- Migrate from Grafana Agent Flow
If you are using vanilla OpenTelemetry Collector:
In my experience they are not 100% plug-and-play but they will help for sure.
Closing Thoughts
I'm thrilled to have migrated my project to Alloy Collector. Grafana Cloud's free tier offers a great starting point for small-scale deployments, and the option to switch to an on-premise setup provides flexibility. For those still using Flow Agent, it's time to make the jump to Alloy and reap the benefits of improved performance and scalability.
Find more here:
- From Agent to Alloy: Why we transitioned to the Alloy collector and why you should, too | Grafana Labs
- Introducing an OpenTelemetry Collector distribution with built-in Prometheus pipelines: Grafana Alloy | Grafana Labs
- Grafana Alloy | Grafana Alloy documentation
With many and more features, full open-source development and standard compatibility it will be my monitoring solution of choice for the time being.
Feel free to subscribe down below to stay in touch I'll make sure to report if things will change in that regard.